
Hi There!
I’m Frida — a Ph.D. candidate in Geography at UCLA, where I study polar climates with a focus on Antarctic sea ice. My research explores the physical processes behind sea ice variability, particularly the seasonal cycles of sea ice advance and retreat. I use statistics and remote sensing to better understand how these cycles are shaped by both external (e.g., solar forcing) and internal (e.g., atmospheric circulation) influences — with the broader goal of improving predictions of future climate behavior.
As a graduate student, I’m also deeply involved in teaching. Being a first-generation immigrant and college student, academia wasn’t always familiar territory. But through the support of mentors and the curiosity sparked by coursework, I’ve grown committed to bridging the gap between research and education. I hope to inspire others, to see themselves in science and pursue research that excites them.
Antarctic Sea Ice Phase
My current work focuses on the phase of Antarctic sea ice — the time it advances and retreats — using daily sea ice data from 1979 to present. I investigate how this timing is influenced by large-scale atmospheric patterns like the Southern Annular Mode, Semi-Annual Oscillation, and Zonal Wave 3. By accounting for both internal climate variability and external forcings like solar radiation, I aim to more precisely capture how sea ice responds to the atmosphere — or perhaps how it helps drive it.
The image below shows how Antarctic sea ice extent follows a broadly coherent annual cycle when averaged across the entire region. Retreat (around September) and advance (around February) appear sharply defined.
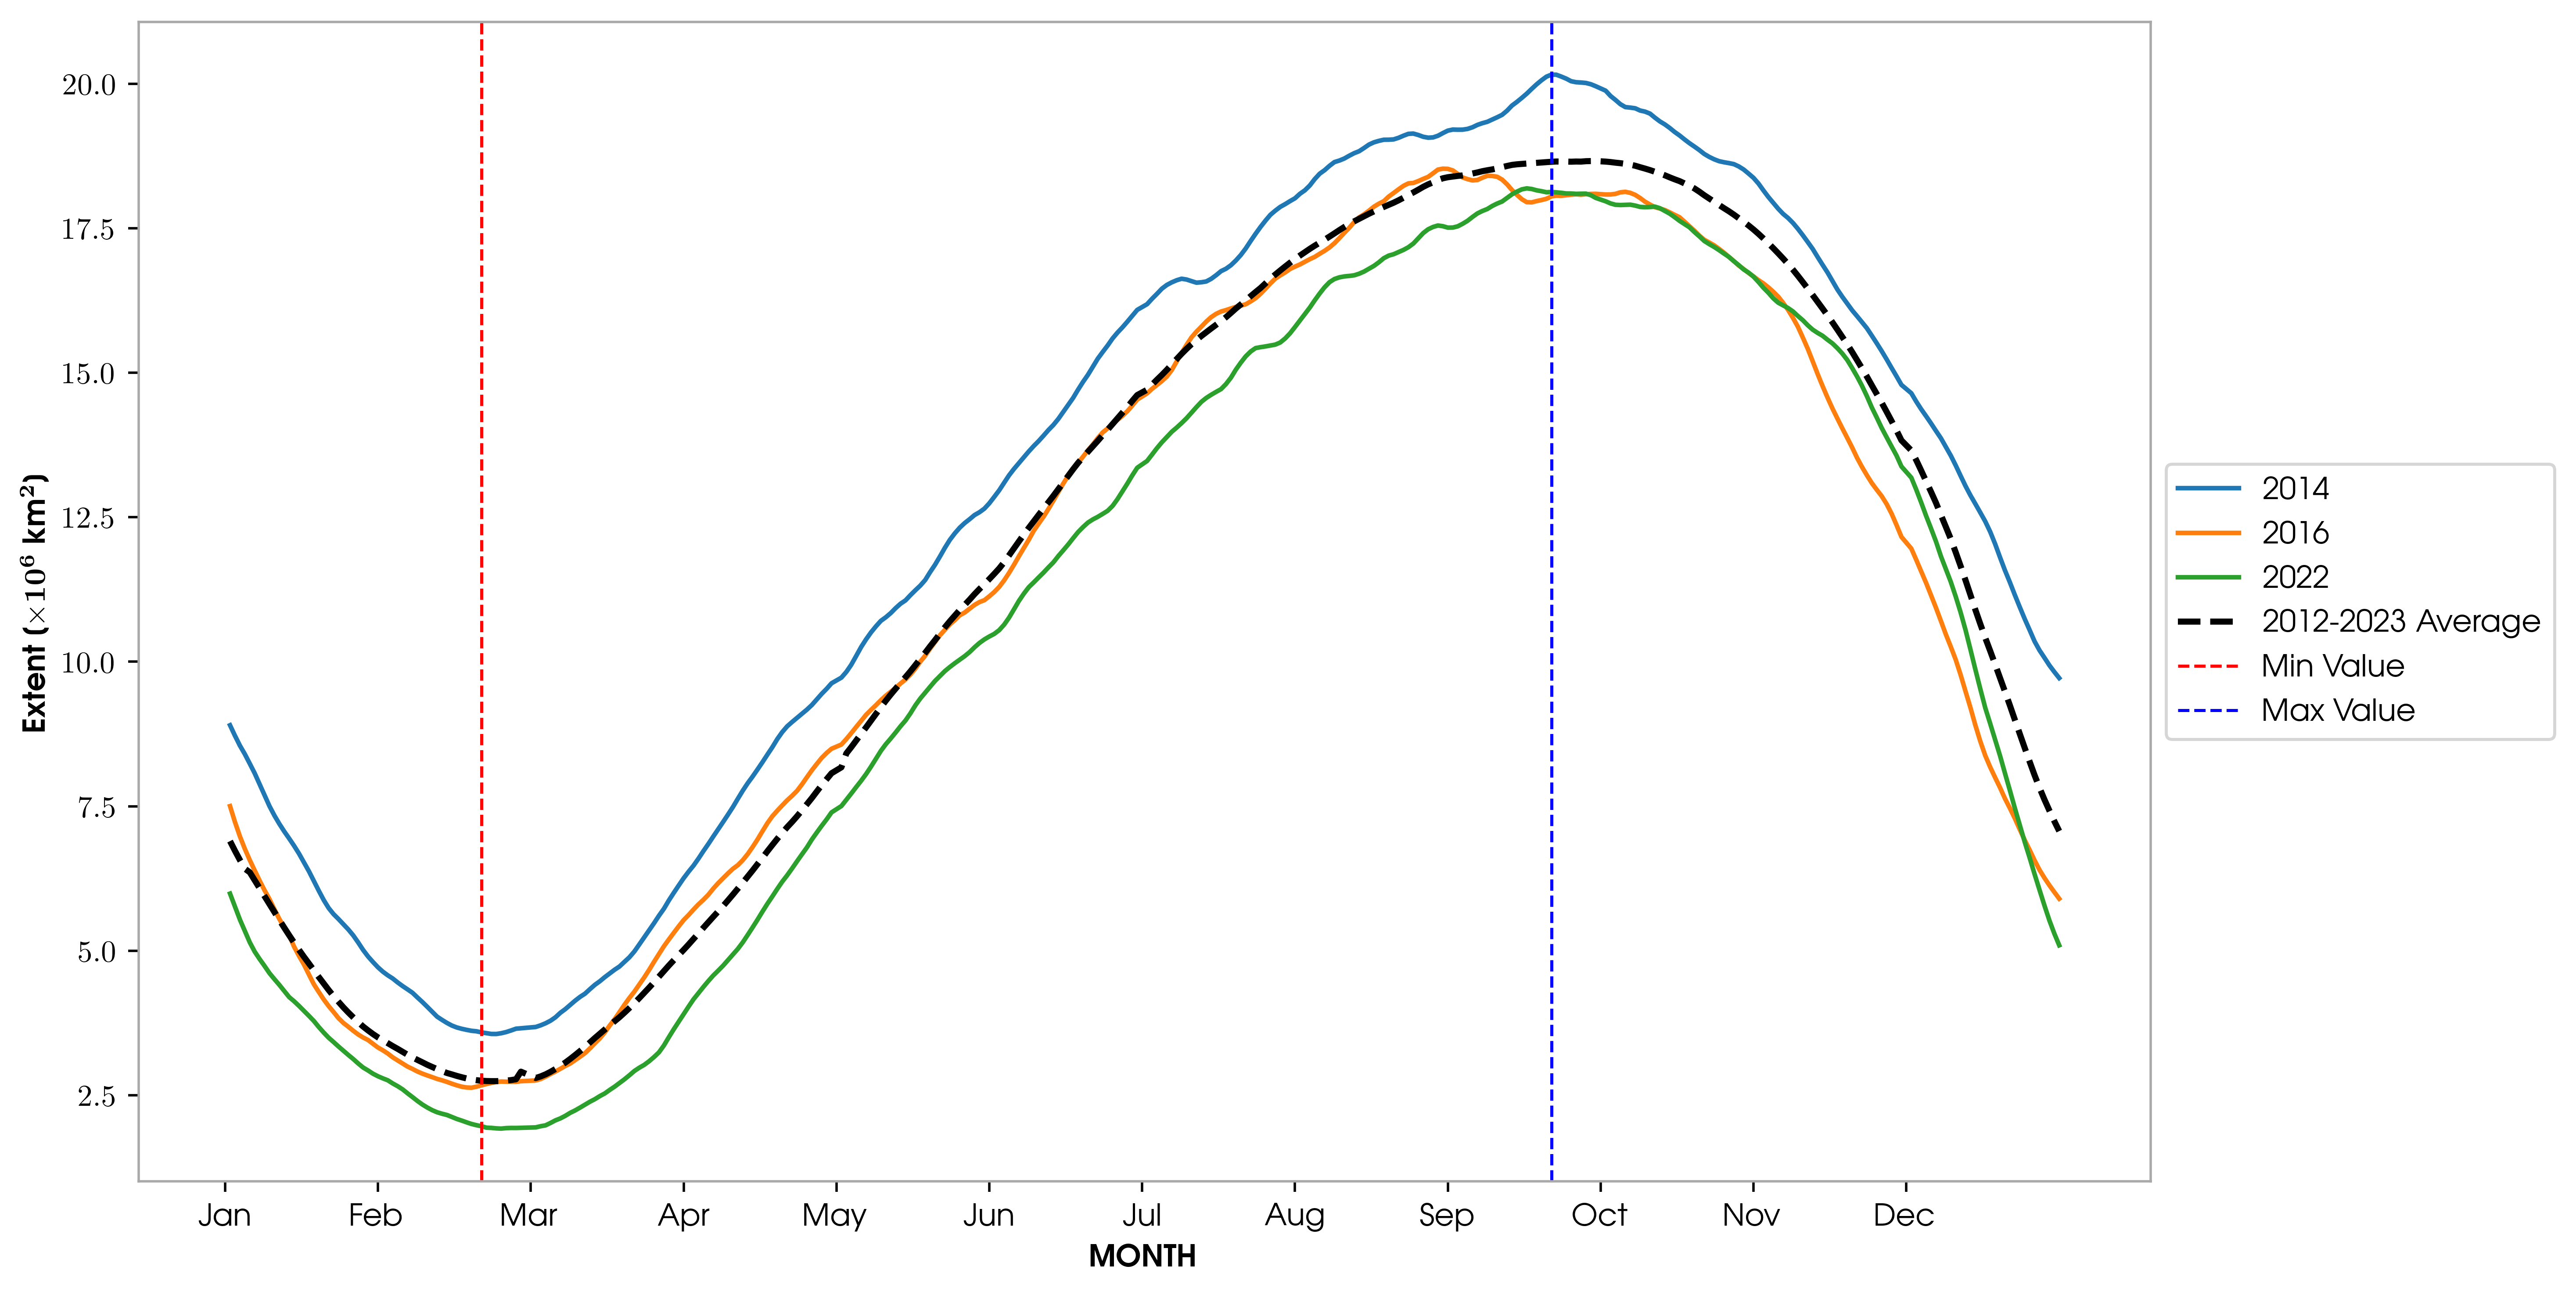
But spatially and temporally, this timing is far from uniform, especially for retreat. We can see also, how the timing of freeze and melt of the ice directly affect how long the ocean is covered by ice, whic is critical to the climate system.
| Advance | Retreat | Duration |
|---|---|---|
 |  |  |
This work contributes to better models of sea ice behavior, especially those that account for daily to sub-seasonal variability, and provides a framework for understanding phase as a driver of broader sea ice trends.
Sea Ice Thickness
Sea ice thickness (SIT) has historically been difficult to measure due to the challenges of acquiring data at depth. However, starting in the early 2000s, estimates of SIT from satellites like CryoSat and Envisat became available. These polar-orbiting satellites use radar altimetry to measure the ice. A radar signal is sent from the satellite, and the time it takes to return is used to calculate the height of the ice above sea level, known as the freeboard (see image below).
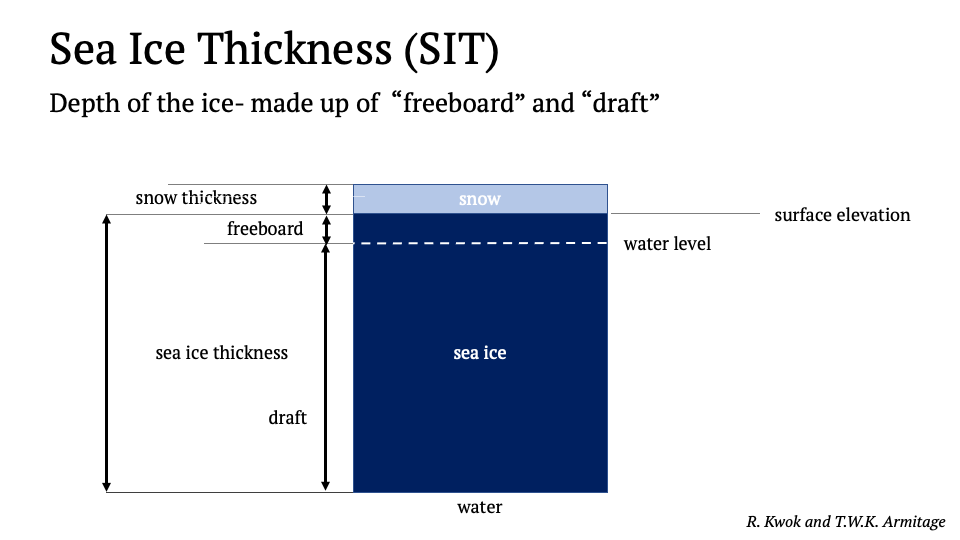
- Freeboard: The height of the sea ice and snow layers above sea level.
- Draft: The part of the ice below sea level, which, when combined with the freeboard, allows us to estimate the total ice thickness.
By using the freeboard measurement and the known density of ice, the overall thickness of the sea ice can be calculated. This method is similar to how sea level is measured using radar altimetry—by determining the time it takes for the radar pulse to return, we can calculate the distance from the satellite to the surface and isolate the freeboard by subtracting the satellite’s orbit.
Using satellite altimetry data from Envisat and CryoSat-2, I analyzed the spatial and temporal variation of SIT and sea ice volume (SIV) around Antarctica from 2003 to 2011.
Key Findings: The thickest ice was found near the continent, with more variability along the sea ice edge.
SIT and SIA Relationship: By examining the relationship between sea ice area (SIA) and SIT, I discovered complex interactions, with positive and negative correlations across different regions. These insights are crucial for accurately estimating sea ice volume.
This work enhances our understanding of how Antarctic sea ice regulates energy exchange between the ocean and atmosphere, improving predictions of sea ice trends, which are critical for assessing the global climate system.