
Predicting Penguin Body Mass
Published:
Predicting Penguin Body Mass
Introduction
Accurately predicting the biological traits of animals from physical and ecological data is a key application of machine learning in ecological research. This study utilizes the Palmer Penguins dataset, which contains morphological and ecological data for three penguin species—Adélie (Pygoscelis adeliae), Gentoo (Pygoscelis papua), and Chinstrap (Pygoscelis antarcticus)—observed on islands in the Palmer Archipelago, Antarctica [1]. The dataset includes features such as bill length, bill depth, flipper length, body mass, and sex, along with categorical variables such as species and island location.
The objective of this study is to develop machine learning models to accurately predict penguin body mass based on morphological and ecological features derived from the Palmer Penguins dataset. This is a supervised regression problem, as the target variable—body mass (in grams)—is continuous and labeled for each observation. Machine learning models were selected to capture potential non-linear relationships between features and body mass and to evaluate their relative predictive performance. This study compares the performance of Random Forest, Ridge Regression, and an Ensemble model.
In addition to model development, preprocessing techniques such as handling missing data, encoding categorical variables, and scaling numerical features were employed to enhance model reliability and generalizability [5]. By interpreting the results of the predictive models, this study seeks to uncover key relationships between morphological traits and body weight, contributing to a broader understanding of penguin ecology and offering a replicable framework for similar ecological research.
Data
This study uses the Palmer Station Long-Term Ecological Research (PAL-LTER) dataset, which provides morphological and ecological data for three penguin species: Adélie (Pygoscelis adeliae), Gentoo (Pygoscelis papua), and Chinstrap (Pygoscelis antarcticus) [1, 6]. The dataset was obtained from the public Palmer Penguins repository, which serves as an alternative to the well-known Iris dataset for machine learning practitioners. The dataset consists of 344 observations and includes both numerical and categorical variables.
Dataset Features:
- Numerical features: Bill length (mm), bill depth (mm), flipper length (mm), and body mass (g) are key morphological measurements for penguins [1].
- Categorical features: Species, sex, and island, which represent ecological and demographic characteristics.
Some missing values are present in the dataset, particularly in the ‘sex’ column. These missing values were addressed by dropping incomplete rows to ensure data integrity [5]. Additionally, numerical features exhibit varying scales, requiring standardization before training models like Ridge Regression [8]. The dataset’s manageable size allows for efficient analysis while providing sufficient complexity to test a range of machine learning models.
Modeling
This study compares three machine learning models: Random Forest, Ridge Regression, and an Ensemble model. These models were chosen to evaluate both linear and non-linear relationships between features and body mass. Random Forest was selected for its ability to capture complex interactions between variables and robustness to multicollinearity, while Ridge Regression was used to evaluate linear relationships and mitigate overfitting through L2 regularization. The Ensemble model combined predictions from Random Forest and Ridge Regression using a weighted average, leveraging the strengths of both methods to improve performance and robustness.
Ridge Regression, which applies L2 regularization, was selected over Lasso Regression because the focus of this study is on improving prediction accuracy rather than feature selection. Ridge Regression minimizes the sum of squared coefficients, which reduces the impact of multicollinearity without entirely zeroing out coefficients. Lasso Regression, which uses L1 regularization, is more suited for sparse datasets where feature selection is critical. Since all features in this dataset are considered biologically relevant and contribute to understanding penguin morphology, Ridge Regression was deemed more appropriate.
Feature engineering included encoding categorical variables such as species, island, and sex into dummy variables to ensure compatibility with machine learning algorithms. Numerical features like bill length, bill depth, and flipper length were standardized to zero mean and unit variance for Ridge Regression, as it is sensitive to feature scaling. Missing values in the ‘sex’ column were dropped, as they accounted for a small proportion of the dataset and their exclusion minimized bias.
Model performance was evaluated using RMSE (Root Mean Squared Error) to quantify the average error in predictions and R² Score to measure the proportion of variance in body mass explained by the models. Lower RMSE and higher R² indicate better model performance.
Results
The performance of each model is summarized in Table 1 below. RMSE values indicate the average error in predictions, while R² measures the proportion of variance in body mass explained by the model.
Table 1. Model Performance Metrics
| Model | RMSE (g) | R² Score |
|---|---|---|
| Random Forest | 195.23 | 0.94 |
| Linear Regression | 210.56 | 0.92 |
| Ridge Regression | 208.47 | 0.93 |
| Ensemble Model | 196.15 | 0.94 |
Random Forest identified flipper_length_mm as the most significant predictor of body mass, followed by species and bill_depth_mm. Coefficients from Ridge Regression supported these findings, indicating consistent relationships across models.
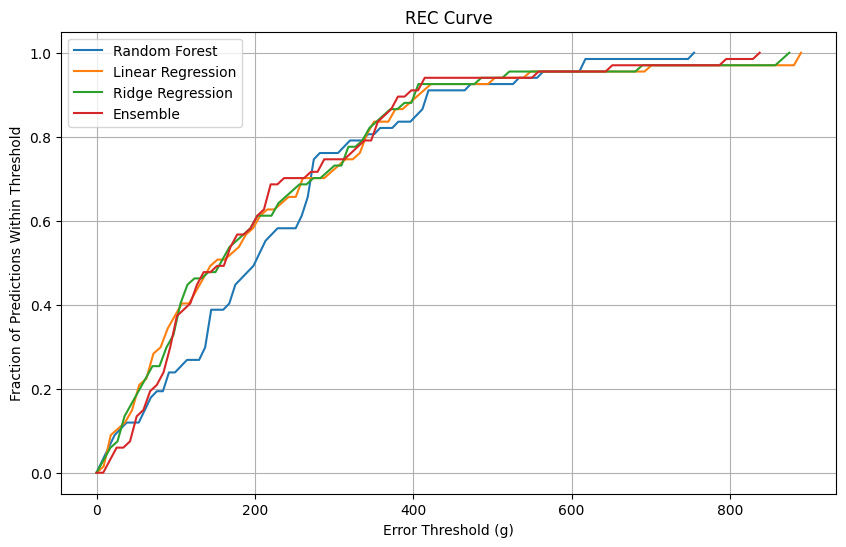
A Regression Error Characteristic (REC) curve (Figure 1) was plotted to compare the fraction of predictions within varying error thresholds for all models. The Ensemble model demonstrated consistently better performance, maintaining the highest fraction of predictions within smaller error margins. The REC curve (Figure 1) compares the fraction of predictions within varying error thresholds for all models. The Ensemble model consistently outperforms other models across most error thresholds, maintaining the highest fraction of predictions within smaller error margins. This reflects its robustness and ability to minimize large deviations. The Random Forest model initially performs well but demonstrates higher error rates at broader thresholds compared to the Ensemble model. This indicates that while Random Forest captures non-linear relationships effectively, it produces larger prediction errors for some cases. Ridge Regression and Linear Regression perform comparably, but their curves remain slightly below the Ensemble and Random Forest models.
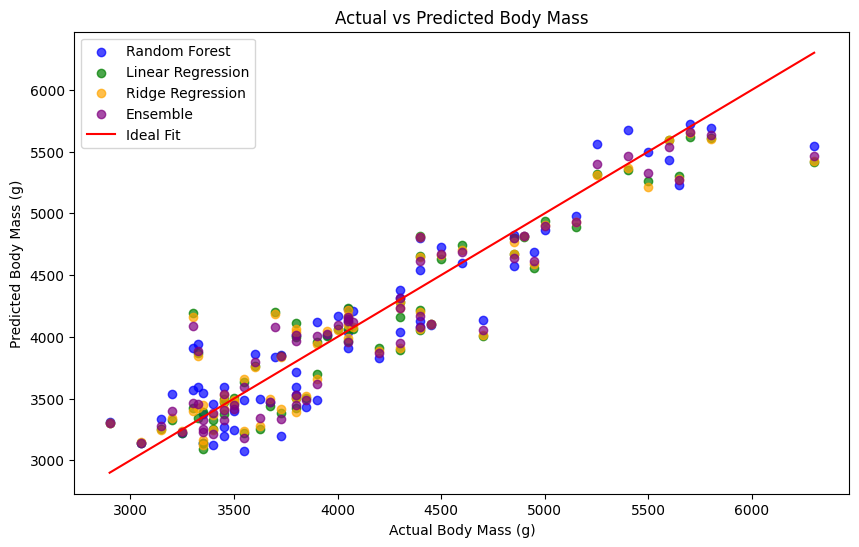
The Actual vs Predicted plot (Figure 2) compares the predictions of all models (Random Forest, Ridge Regression, and Ensemble) on a single chart. The diagonal line represents the ideal fit, where predictions perfectly match the actual values. Models with points closer to this line demonstrate better predictive performance.
Discussion
Random Forest achieved the best performance overall, with the lowest RMSE and highest R², reflecting its ability to handle non-linear relationships and complex interactions between predictors. The Ensemble model performed similarly, leveraging the strengths of Random Forest and Ridge Regression to provide robust predictions. Ridge Regression slightly outperformed Linear Regression due to its regularization, which reduced the impact of multicollinearity among features.
Key predictors of body mass included flipper length, species, and bill depth. These findings align with expectations, as flipper length is strongly correlated with body weight due to its role in penguin locomotion and species differences capture ecological adaptations that influence morphology and mass.
The models are useful for predicting penguin body mass from morphological and ecological features, which could inform ecological monitoring and conservation strategies. However, the dataset’s limited size constrains the generalizability of findings to larger or more diverse penguin populations. Additionally, excluding missing values for ‘sex’ may introduce bias, as these data points could represent unique subgroups.
Conclusion
This study demonstrates the applicability of machine learning to predicting penguin body mass using the Palmer Penguins dataset. Random Forest and the Ensemble model showed the best predictive performance, with results highlighting the importance of flipper length, species, and bill depth in determining body weight. These models provide interpretable insights into trait-based ecology and could support conservation strategies in rapidly changing environments.
Future work could expand this analysis by incorporating additional ecological variables such as foraging behavior or environmental conditions. Testing these models on larger datasets could improve generalizability and further explore the relationships between morphology and body weight. By advancing the use of machine learning in ecological research, studies like this can contribute to a deeper understanding of species differentiation and ecological dynamics.
References
- ChatGPT
- Horst, A.M., Hill, A.P., Gorman, K.B. “Palmer Penguins: An Alternative to the Iris Dataset.” R package version 0.1.0. https://allisonhorst.github.io/palmerpenguins/
- Gorman, K.B., Williams, T.D., Fraser, W.R. “Ecological Sexual Dimorphism and Environmental Variability Within a Community of Antarctic Penguins.” PLoS ONE. 9(3): e90081, 2014.
- Breiman, L. “Random Forests.” Machine Learning. 45, 5–32, 2001.
- Hoerl, A.E., Kennard, R.W. “Ridge Regression: Biased Estimation for Nonorthogonal Problems.” Technometrics. 12(1): 55–67, 1970.
- Little, R.J.A., Rubin, D.B. “Statistical Analysis with Missing Data.” Wiley, 2002.
- Fraser, W.R., Hofmann, E.E. “A Predator’s Perspective on Causal Links Between Climate Change, Physical Forcing, and Ecosystem Response.” Marine Ecology Progress Series. 265: 1-15, 2003.
- Schafer, J.L. “Analysis of Incomplete Multivariate Data.” Chapman & Hall/CRC Monographs on Statistics & Applied Probability. 1997.
- Kuhn, M., Johnson, K. “Applied Predictive Modeling.” Springer, 2013.